Ranked it on Google
Keyword plan, on-page work, technical fixes, content and links, reported monthly.
SEO & Local SEO · Houston, TX · current client for 4 years
In today’s fast-paced business landscape, organizations face numerous challenges that require innovative solutions. This case study explores how we partnered with Vega & Associates to address their unique needs and drive significant results: a 56% rise in search impressions, 80% more call clicks and an 81% share of local voice for “immigration attorney” across Houston.
 2020

By the numbers
Figures from the client’s dashboards, Search Console, Google Business Profile or project scope.
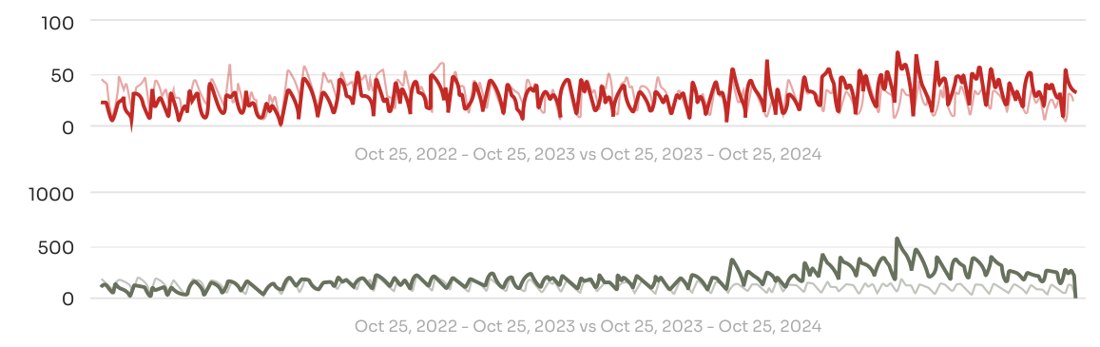
Google Maps results, 2024 vs 2023
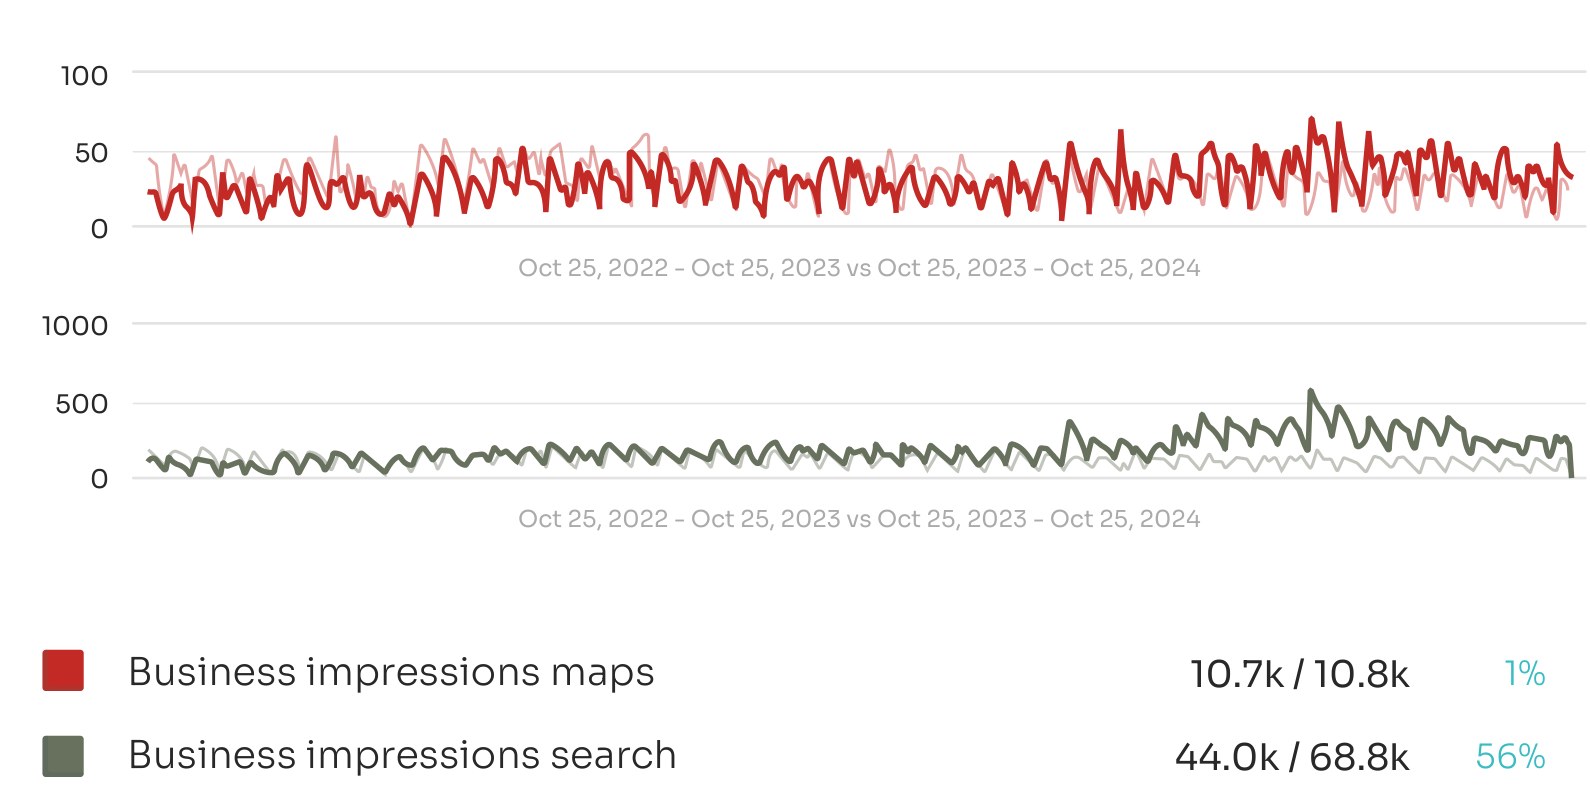
Increase visibility of the business through search and map impressions, with a goal of boosting search impressions by over 50% year-over-year. This will enhance online presence and drive more potential customers to the business.
Business impressions from search rose from 44.0K to 68.8K (+56%), while impressions from Maps held steady at 10.7K to 10.8K.
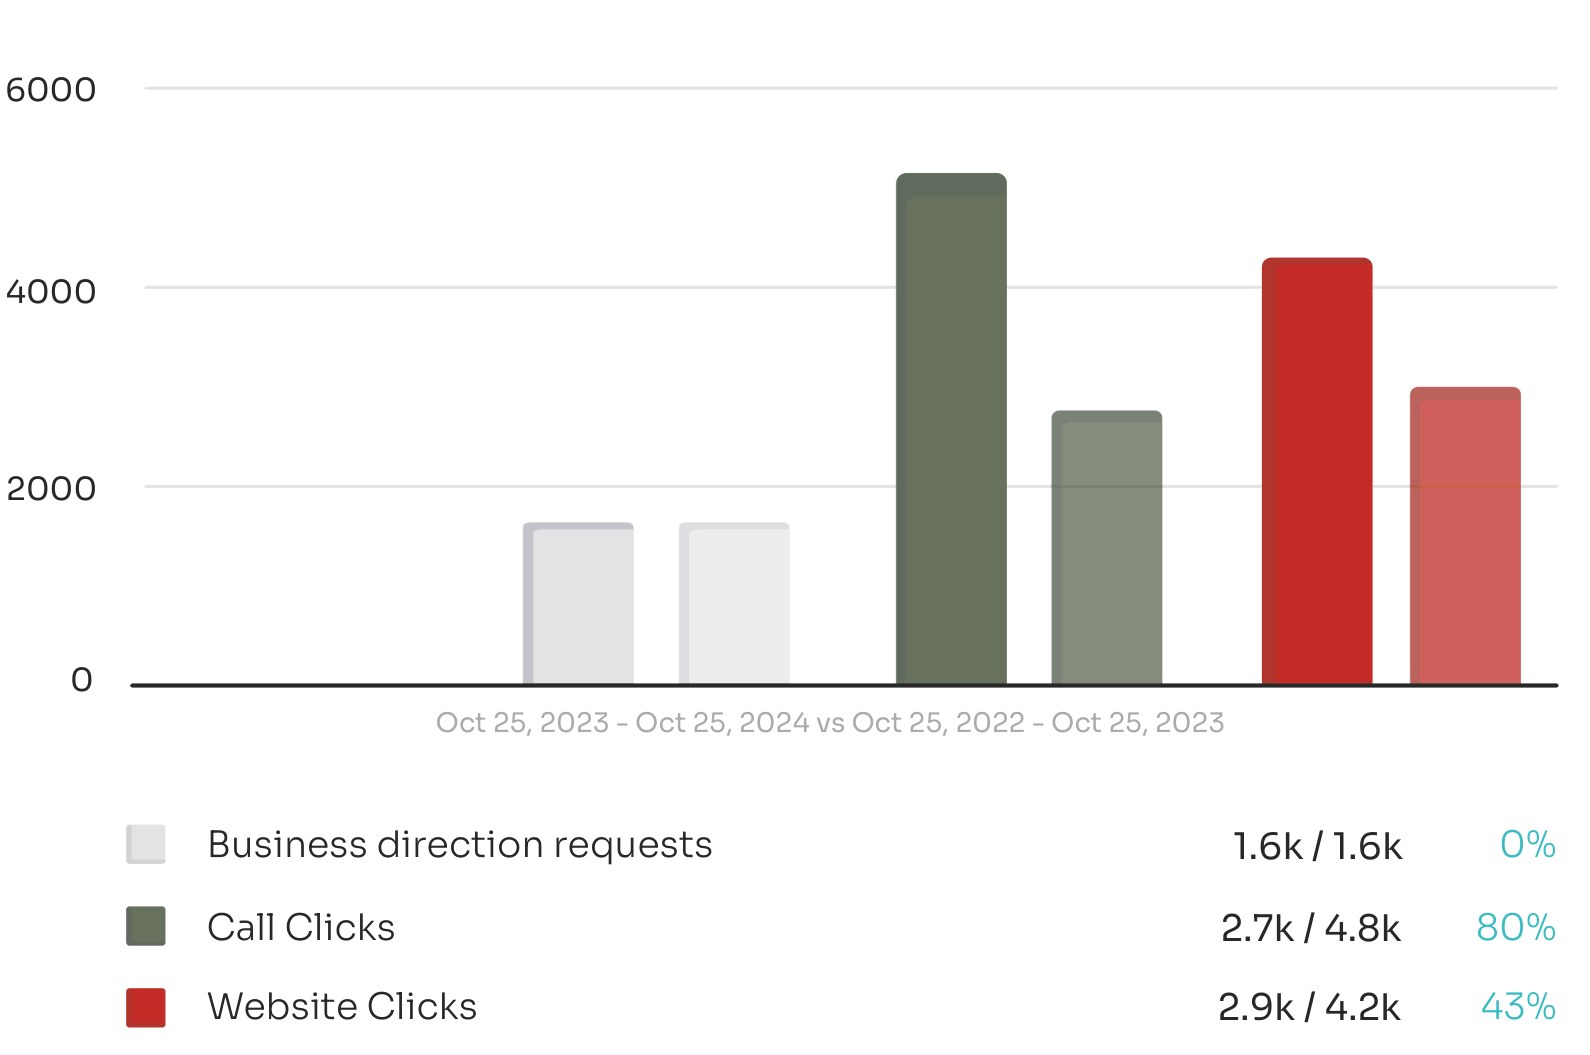
Year-over-year engagement metrics
This graph shows year-over-year changes in user interactions, with strong growth in call clicks (+80%) and website clicks (+43%), reflecting improved customer engagement. Business direction requests remained steady, signaling stable interest with potential for future growth.
Objective: to assess the effectiveness of recent marketing efforts by comparing year-over-year engagement metrics, including business direction requests, call clicks, and website clicks. This analysis helps identify areas of growth and opportunities to further drive customer interactions and engagement.
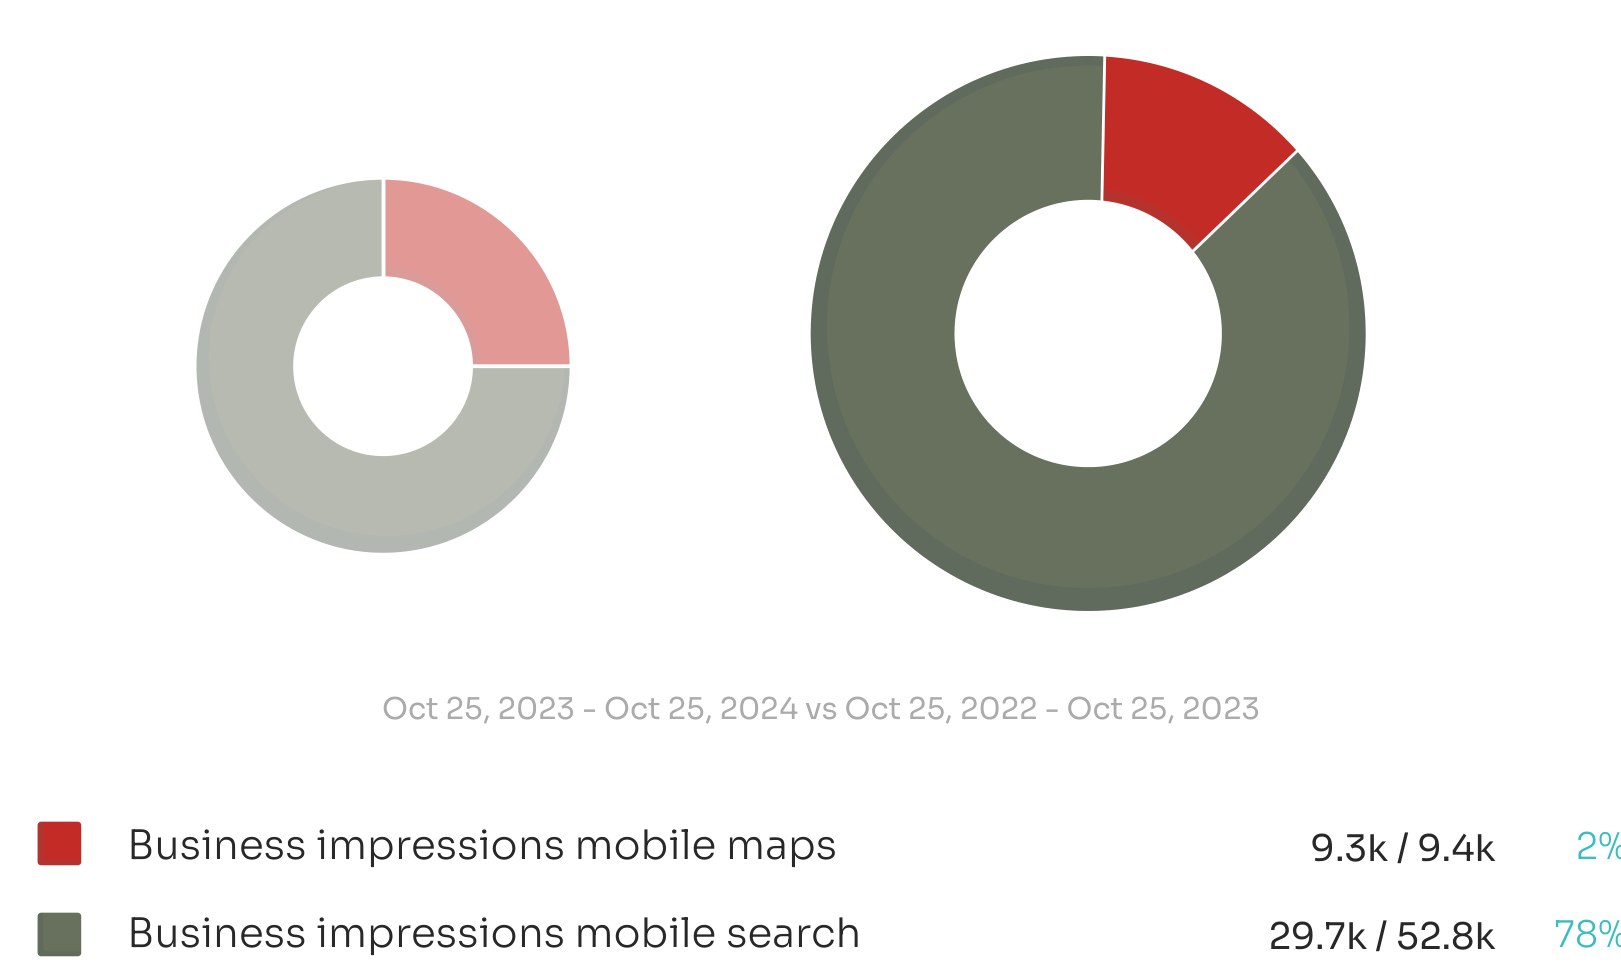
Mobile search & Maps impressions
This chart shows a significant increase in mobile search impressions, up 78% from last year, indicating a boost in visibility through mobile search. Meanwhile, mobile map impressions saw a smaller growth of 2%, highlighting stable exposure through map searches. Together, these metrics reflect growing online visibility and engagement across mobile platforms.
Objective: to evaluate year-over-year performance in mobile search and maps impressions, identifying trends and potential growth opportunities for increased visibility on mobile platforms.
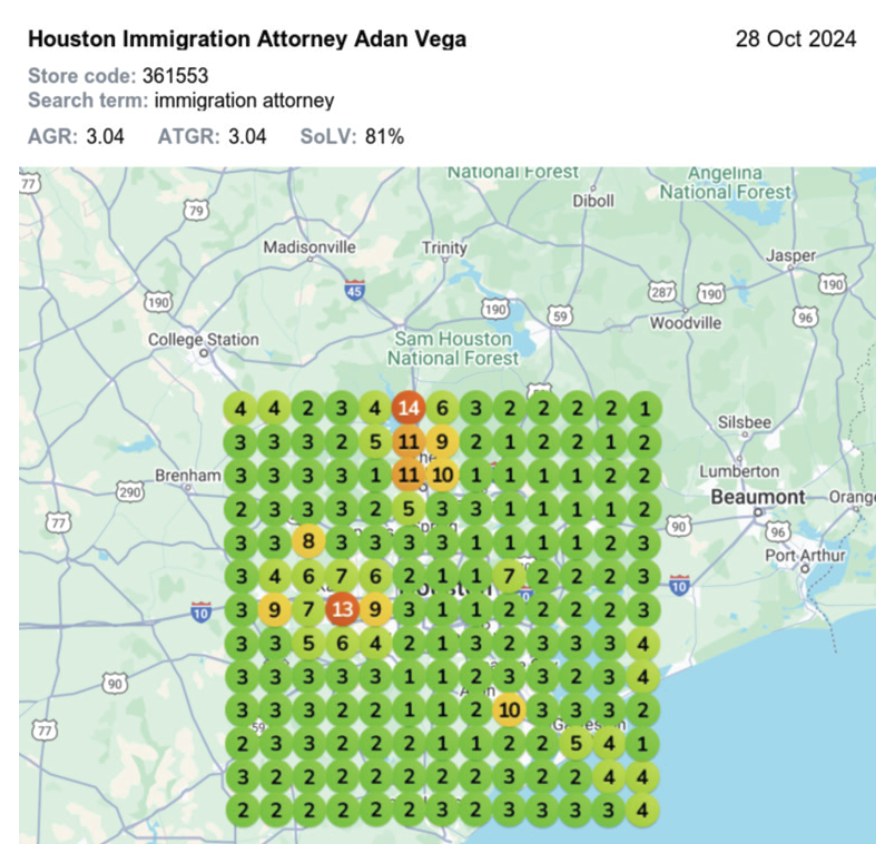
Google Maps ranking grid, 13×13, 8 miles
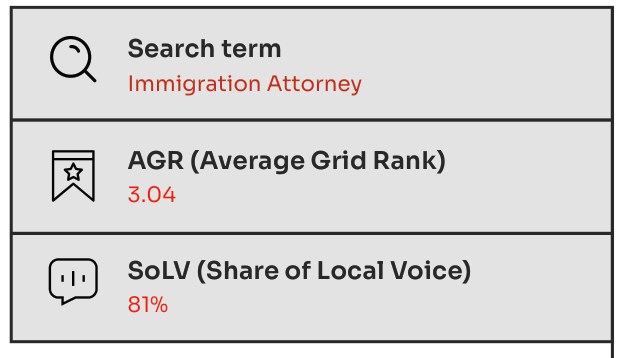
This Google Maps ranking grid for Houston immigration attorney Adan Vega shows a strong local presence across an extended 13×13 grid, covering an 8-mile radius well beyond the Houston metro area. The average Google ranking (AGR) is 3.04, with an above-average top-3 ranking (ATGR) of 3.04 and a significant share of local voice (SoLV) at 81%, indicating high visibility and a solid ranking distribution across the entire target area, including nearby cities like College Station and Beaumont.
Objective: our objective in conducting this local search ranking analysis was to gain a comprehensive view of Adan Vega’s visibility for the search term “immigration attorney” across the Houston area. By mapping out his rankings across different geographic locations, we aimed to:
What we did
Keyword plan, on-page work, technical fixes, content and links, reported monthly.
Google Business Profile, citations, reviews and location pages for the service area.
Editorial links, local sponsorships and press that raise authority without risk.
Service pages, location pages and posts written to rank and to read well.
Explore